...
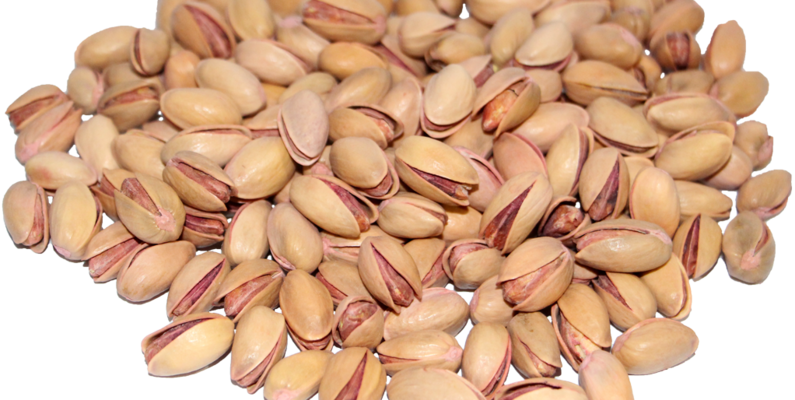
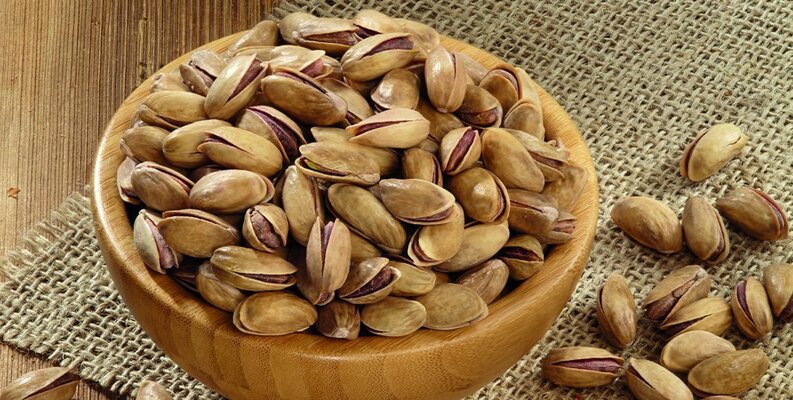
<p>In order to keep the economic value of pistachio nuts which have an important place in the agricultural economy, the efficiency of post-harvest industrial processes is very important. To provide this efficiency, new methods and technologies are needed for the separation and classification of pistachios. Different pistachio species address different markets, which increases the need for the classification of pistachio species. In this study, it is aimed to develop a classification model different from traditional separation methods, based on image processing and artificial intelligence which are capable to provide the required classification. A computer vision system has been developed to distinguish two different species of pistachios with different characteristics that address different market types. 2148 sample image for these two kinds of pistachios were taken with a high-resolution camera. The image processing techniques, segmentation and feature extraction were applied on the obtained images of the pistachio samples. A pistachio dataset that has sixteen attributes was created. An advanced classifier based on k-NN method, which is a simple and successful classifier, and principal component analysis was designed on the obtained dataset. In this study; a multi-level system including feature extraction, dimension reduction and dimension weighting stages has been proposed. Experimental results showed that the proposed approach achieved a classification success of 94.18%. The presented high-performance classification model provides an important need for the separation of pistachio species and increases the economic value of species. In addition, the developed model is important in terms of its application to similar studies.</p> Read More
...
<p>The dataset was obtained as a result of the extinguishing tests of four different fuel flames with a sound wave extinguishing system. The sound wave fire-extinguishing system consists of 4 subwoofers with a total power of 4,000 Watt placed in the collimator cabinet. There are two amplifiers that enable the sound come to these subwoofers as boosted. Power supply that powers the system and filter circuit ensuring that the sound frequencies are properly transmitted to the system is located within the control unit. While computer is used as frequency source, anemometer was used to measure the airflow resulted from sound waves during the extinguishing phase of the flame, and a decibel meter to measure the sound intensity. An infrared thermometer was used to measure the temperature of the flame and the fuel can, and a camera is installed to detect the extinction time of the flame. A total of 17,442 tests were conducted with this experimental setup. The experiments are planned as follows:</p><ol><li>Three different liquid fuels and LPG fuel were used to create the flame.</li><li>5 different sizes of liquid fuel cans are used to achieve different size of flames.</li><li>Half and full gas adjustment is used for LPG fuel.</li><li>While carrying out each experiment, the fuel container, at 10 cm distance, was moved forward up to 190 cm by increasing the distance by 10 cm each time.</li><li>Along with the fuel container, anemometer and decibel meter were moved forward in the same dimensions.</li><li>Fire extinguishing experiments was conducted with 54 different frequency sound waves at each distance and flame size.<br>Throughout the flame extinguishing experiments, the data obtained from each measurement device was recorded and a dataset was created. The dataset includes the features of fuel container size representing the flame size, fuel type, frequency, decibel, distance, airflow and flame extinction. Accordingly, 6 input features and 1 output feature will be used in models. The explanation of a total of seven features for liquid fuels in the dataset is given in Table 1, and the explanation of 7 features for LPG fuel is given in Table 2.<br>The status property (flame extinction or non-extinction states) can be predicted by using six features in the dataset. Status and fuel features are categorical, while other features are numerical. 8,759 of the 17,442 test results are the non-extinguishing state of the flame. 8,683 of them are the extinction state of the flame. According to these numbers, it can be said that the class distribution of the dataset is almost equal."</li></ol><p>KEYWORDS: Fire, Extinguishing System, Sound wave, Machine learning, Fire safety, Low frequency, Acoustic</p><p>Data properties and descriptions for liquid fuels<br>FEATURES MIN/MAX VALUES UNIT DESCRIPTIONS<br>SIZE 7, 12, 14, 16, 20 cm Recorded as 7 cm=1, 12 cm=2, 14 cm=3, 16 cm=4, 20 cm=5<br>FUEL Gasoline, Kerosene, Thinner Fuel type<br>DISTANCE 10 - 190 cm<br>DESIBEL 72 - 113 dB<br>AIRFLOW 0 - 17 m/s<br>FREQUENCY 1-75 Hz<br>STATUS 0, 1 0 indicates the non-extinction state, 1 indicates the extinction state</p><p>Data properties and descriptions for LPG<br>FEATURES MIN/MAX VALUES UNIT DESCRIPTIONS<br>SIZE Half throttle setting, Full throttle setting Reocerded as Half throttle setting=6, Full throttle setting=7<br>FUEL LPG Fuel type<br>DISTANCE 10 - 190 cm<br>DESIBEL 72 - 113 dB<br>AIRFLOW 0 - 17 m/s<br>FREQUENCY 1-75 Hz<br>STATUS 0, 1 0 indicates the non-extinction state, 1 indicates the extinction state</p> Read More
...
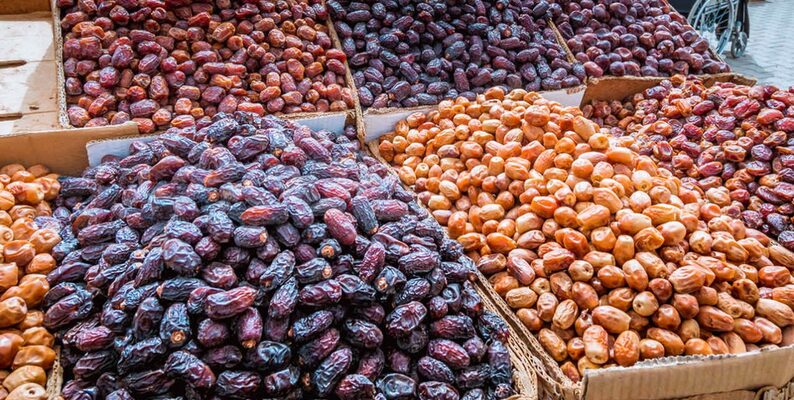
<p>A great number of fruits are grown around the world, each of which has various types. The factors that determine the type of fruit are the external appearance features such as color, length, diameter, and shape. The external appearance of the fruits is a major determinant of the fruit type. Determining the variety of fruits by looking at their external appearance may necessitate expertise, which is time-consuming and requires great effort. The aim of this study is to classify the types of date fruit, that are, Barhee, Deglet Nour, Sukkary, Rotab Mozafati, Ruthana, Safawi, and Sagai by using three different machine learning methods. In accordance with this purpose, 898 images of seven different date fruit types were obtained via the computer vision system (CVS). Through image processing techniques, a total of 34 features, including morphological features, shape, and color, were extracted from these images. First, models were developed by using the logistic regression (LR) and artificial neural network (ANN) methods, which are among the machine learning methods. Performance results achieved with these methods are 91.0% and 92.2%, respectively. Then, with the stacking model created by combining these models, the performance result was increased to 92.8%. It has been concluded that machine learning methods can be applied successfully for the classification of date fruit types.</p> Read More
...
<p>Pumpkin seeds are frequently consumed as confection worldwide because of their adequate amount of protein, fat, carbohydrate, and mineral contents. This study was carried out on the two most important and quality types of pumpkin seeds, ‘‘Urgup_Sivrisi’’ and ‘‘Cercevelik’’, generally grown in Urgup and Karacaoren regions in Turkey. However, morphological measurements of 2500 pumpkin seeds of both varieties were made possible by using the gray and binary forms of threshold techniques. Considering morphological features, all the data were modeled with five different machine learning methods: Logistic Regression (LR), Multilayer Perceptrons (MLP), Support Vector Machine (SVM) and Random Forest (RF), and k-Nearest Neighbor (k-NN), which further determined the most successful method for classifying pumpkin seed varieties. However, the performances of the models were determined with the help of the 10 kfold cross-validation method. The accuracy rates of the classifiers were obtained as LR 87.92 percent, MLP 88.52 percent, SVM 88.64 percent, RF 87.56 percent, and k-NN 87.64 percent.</p><p>Keywords Pumpkin seed Logistic regression, Multilayer peceptrons, Random forest, Classification, Support vector machine, Thresholding</p> Read More
...
<p>In order to keep the economic value of pistachio nuts which have an important place in the agricultural economy, the efficiency of post-harvest industrial processes is very important. To provide this efficiency, new methods and technologies are needed for the separation and classification of pistachios. Different pistachio species address different markets, which increases the need for the classification of pistachio species. In this study, it is aimed to develop a classification model different from traditional separation methods, based on image processing and artificial intelligence which are capable to provide the required classification. A computer vision system has been developed to distinguish two different species of pistachios with different characteristics that address different market types. 2148 sample image for these two kinds of pistachios were taken with a high-resolution camera. The image processing techniques, segmentation and feature extraction were applied on the obtained images of the pistachio samples. A pistachio dataset that has sixteen attributes was created. An advanced classifier based on k-NN method, which is a simple and successful classifier, and principal component analysis was designed on the obtained dataset. In this study; a multi-level system including feature extraction, dimension reduction and dimension weighting stages has been proposed. Experimental results showed that the proposed approach achieved a classification success of 94.18%. The presented high-performance classification model provides an important need for the separation of pistachio species and increases the economic value of species. In addition, the developed model is important in terms of its application to similar studies.<br>Keywords: Classification, Image processing, k nearest neighbor classifier, Pistachio species</p> Read More
...
<p>Feature extraction processes were performed based on the image processing techniques using morphological, shape and color features for five different rice varieties of the same brand. A total of 75 thousand pieces of rice grain were obtained, including 15 thousand pieces of each variety of rice. Pre-processing operations were applied to the images and made available for feature extraction. A total of 106 features were inferred from the images; 12 morphological features and 4 shape features obtained using morphological features and 90 color features obtained from five different color spaces (RGB, HSV, L<i>a</i>b*, YCbCr, XYZ). In addition, for the 106 features obtained, features were selected by ANOVA, X2 and Gain Ratio tests and useful features were determined. In all tests, out of 106 features, the 5 most effective and specific features were obtained roundness, compactness, shape factor 3, aspect ratio and eccentricity. The color features were listed in different order following these features.</p> Read More
...
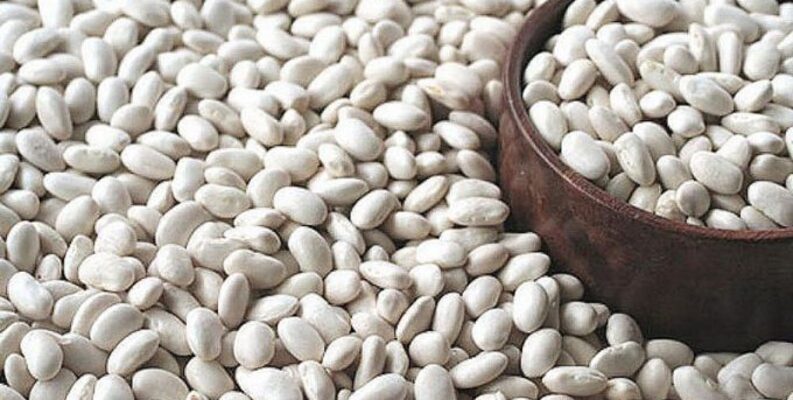
<p>Abstract: Images of 13,611 grains of 7 different registered dry beans were taken with a high-resolution camera. A total of 16 features; 12 dimensions and 4 shape forms, were obtained from the grains.</p><p>Relevant Information:<br>Seven different types of dry beans were used in this research, taking into account the features such as form, shape, type, and structure by the market situation. A computer vision system was developed to distinguish seven different registered varieties of dry beans with similar features in order to obtain uniform seed classification. For the classification model, images of 13,611 grains of 7 different registered dry beans were taken with a high-resolution camera. Bean images obtained by computer vision system were subjected to segmentation and feature extraction stages, and a total of 16 features; 12 dimensions and 4 shape forms, were obtained from the grains.</p><p>Attribute Information:<br>1.) Area (A): The area of a bean zone and the number of pixels within its boundaries.<br>2.) Perimeter (P): Bean circumference is defined as the length of its border.<br>3.) Major axis length (L): The distance between the ends of the longest line that can be drawn from a bean.<br>4.) Minor axis length (l): The longest line that can be drawn from the bean while standing perpendicular to the main axis.<br>5.) Aspect ratio (K): Defines the relationship between L and l.<br>6.) Eccentricity (Ec): Eccentricity of the ellipse having the same moments as the region.<br>7.) Convex area (C): Number of pixels in the smallest convex polygon that can contain the area of a bean seed.<br>8.) Equivalent diameter (Ed): The diameter of a circle having the same area as a bean seed area.<br>9.) Extent (Ex): The ratio of the pixels in the bounding box to the bean area.<br>10.)Solidity (S): Also known as convexity. The ratio of the pixels in the convex shell to those found in beans.<br>11.)Roundness (R): Calculated with the following formula: (4piA)/(P^2)<br>12.)Compactness (CO): Measures the roundness of an object: Ed/L<br>13.)ShapeFactor1 (SF1)<br>14.)ShapeFactor2 (SF2)<br>15.)ShapeFactor3 (SF3)<br>16.)ShapeFactor4 (SF4)<br>17.)Class (Seker, Barbunya, Bombay, Cali, Dermosan, Horoz and Sira)</p> Read More
...
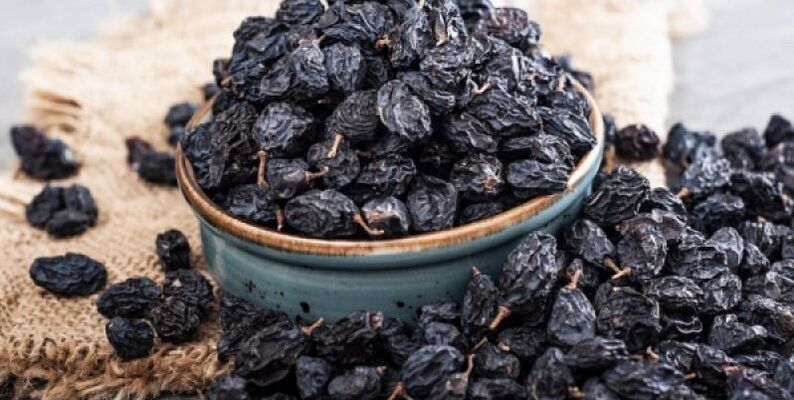
<p>In this study, machine vision system was developed in order to distinguish between two different variety of raisins (Kecimen and Besni) grown in Turkey. Firstly, a total of 900 pieces raisin grains were obtained, from an equal number of both varieties. These images were subjected to various preprocessing steps and 7 morphological feature extraction operations were performed using image processing techniques. In addition, minimum, mean, maximum and standard deviation statistical information was calculated for each feature. The distributions of both raisin varieties on the features were examined and these distributions were shown on the graphs. Later, models were created using LR, MLP, and SVM machine learning techniques and performance measurements were performed. The classification achieved 85.22% with LR, 86.33% with MLP and 86.44% with the highest classification accuracy obtained in the study with SVM. Considering the number of data available, it is possible to say that the study was successful.</p> Read More
...
<p>Relevant Information: In order to classify the rice varieties (Cammeo and Osmancik) used, preliminary processing was applied to the pictures obtained with computer vision system and a total of 3810 rice grains were obtained. Furthermore, 7 morphological features have been inferred for each grain. A data set has been created for the properties obtained.</p><p>Attribute Information:</p><ol><li>Area: Returns the number of pixels within the boundaries of the rice grain.</li><li>Perimeter: Calculates the circumference by calculating the distance between pixels around the boundaries of the rice grain.</li><li>Major Axis Length: The longest line that can be drawn on the rice grain, i.e. the main axis distance, gives.</li><li>Minor Axis Length: The shortest line that can be drawn on the rice grain, i.e. the small axis distance, gives.</li><li>Eccentricity: It measures how round the ellipse, which has the same moments as the rice grain, is.</li><li>Convex Area: Returns the pixel count of the smallest convex shell of the region formed by the rice grain.</li><li>Extent: Returns the ratio of the region formed by the rice grain to the bounding box pixels</li><li>Class: Commeo and Osmancik.</li></ol> Read More